Chart of the Week
Source: Visual Capitalist
Investment Themes by Decade
These decade-defining themes are often the product of a confluence of factors, including the macroeconomic environment, geopolitics, monetary policy, or other structural shifts like technological disruption.
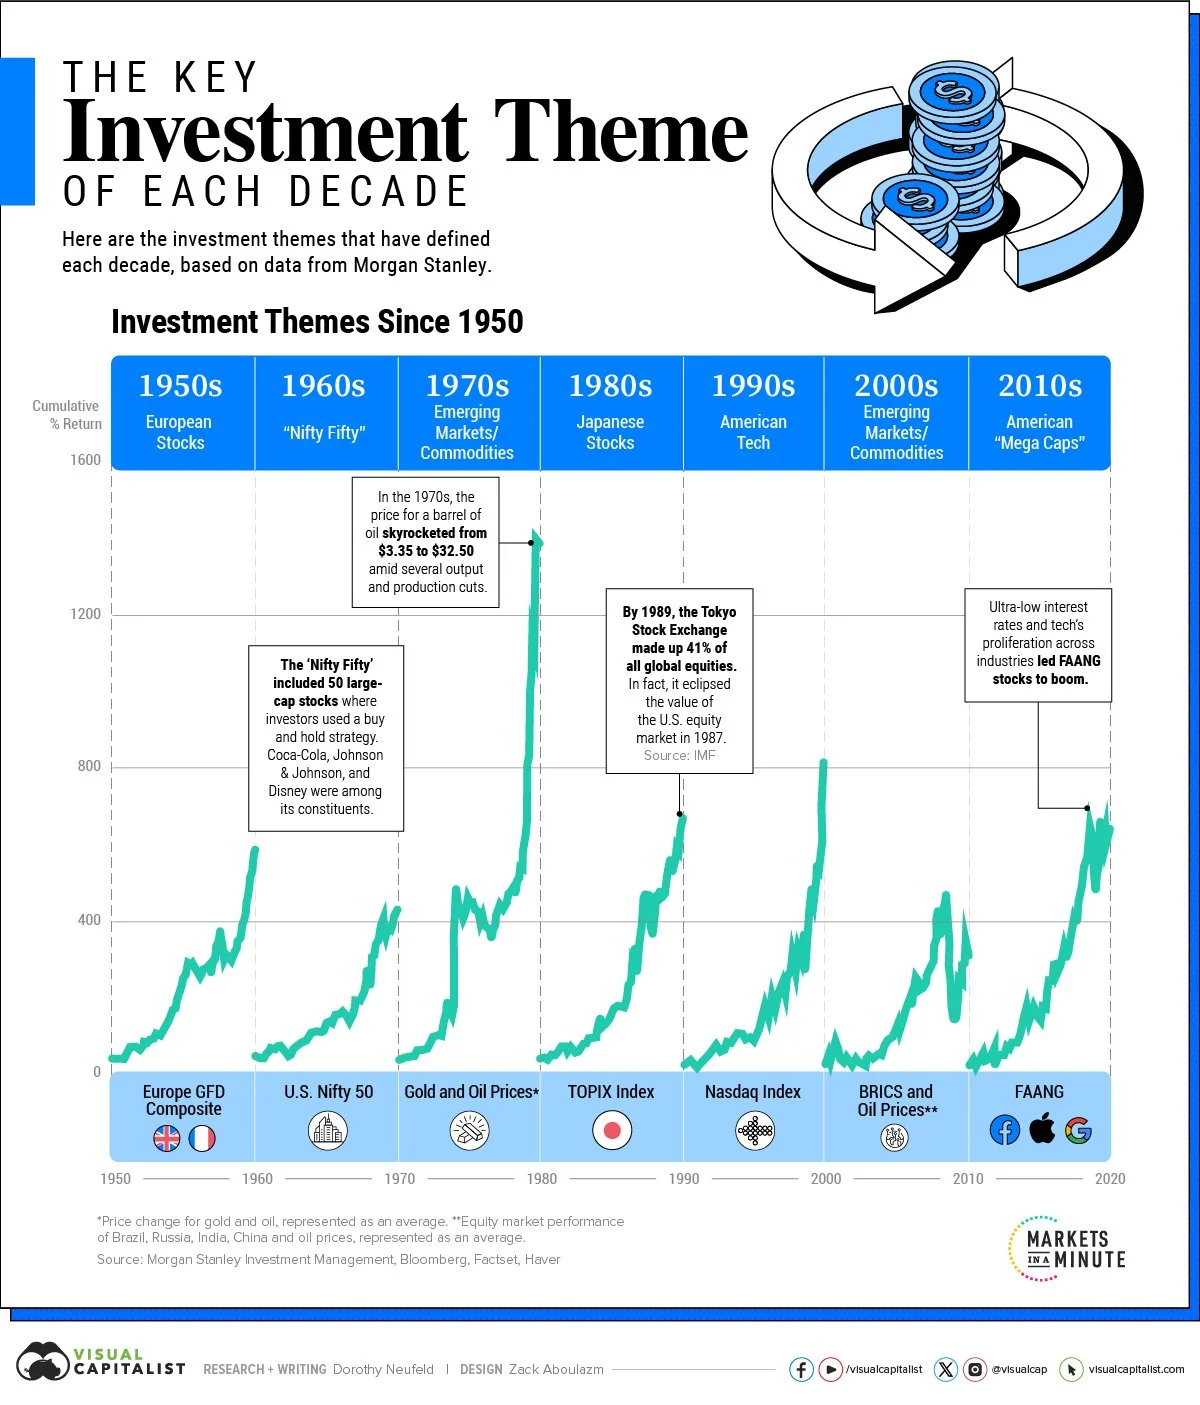
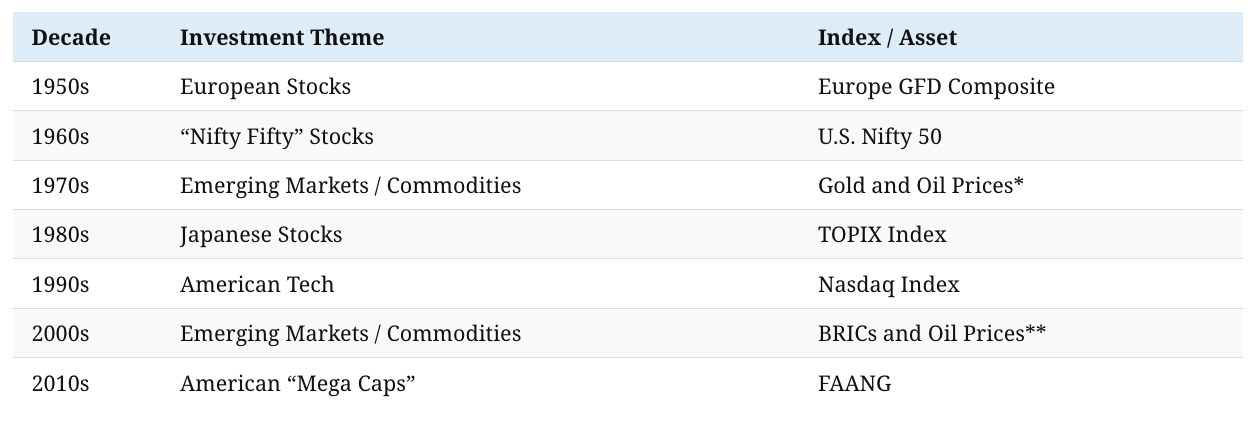
Here are the central investment themes since the 1950s, each with at least 400% cumulative returns over each period:
*Price change for gold and oil, represented as an average. **Equity market performance of Brazil, Russia, India, China and oil prices, represented as an average.
The 1950s saw a boom in European stocks during the post-war recovery. This was fueled by significant investment from corporations and governments as Europe became more integrated.
Then in the 1960s, investors poured into blue chip stocks in the “Nifty Fifty” including Johnson & Johnson, Disney, and Coca-Cola. The main premise was that these strong franchises would deliver high returns over the long run. During the 1973-1974 bear market, shares cratered.
As oil skyrocketed from $3.35 to $32.50 through the 1970s amid production and output cuts, commodities dominated, along with emerging economy exporters of oil and gold.
Later, through the 1980s, Japanese stocks dramatically increased. In 1989, the Tokyo Stock Exchange made up 41% of all global equities. It had eclipsed the value of the U.S. equity market just two years earlier.
In part owing to strong U.S. economic growth, American tech stocks flourished through the 1990s. While many high-flying tech stocks were wiped out during the crash in 2000, some still remain today. Qualcomm, which jumped 2,620% in 1999, is a multi-billion dollar semiconductor company. Amazon and Cisco were other survivors of this era.
Pivoting from growth assets, investors returned to commodities and emerging markets over the 2000s, this time with BRIC economies—Brazil, Russia, India, and China. The 2010s saw the rise of FAANG stocks as tech proliferated across countless industries.


